Operational fit
Built for utility bill analytics workflows
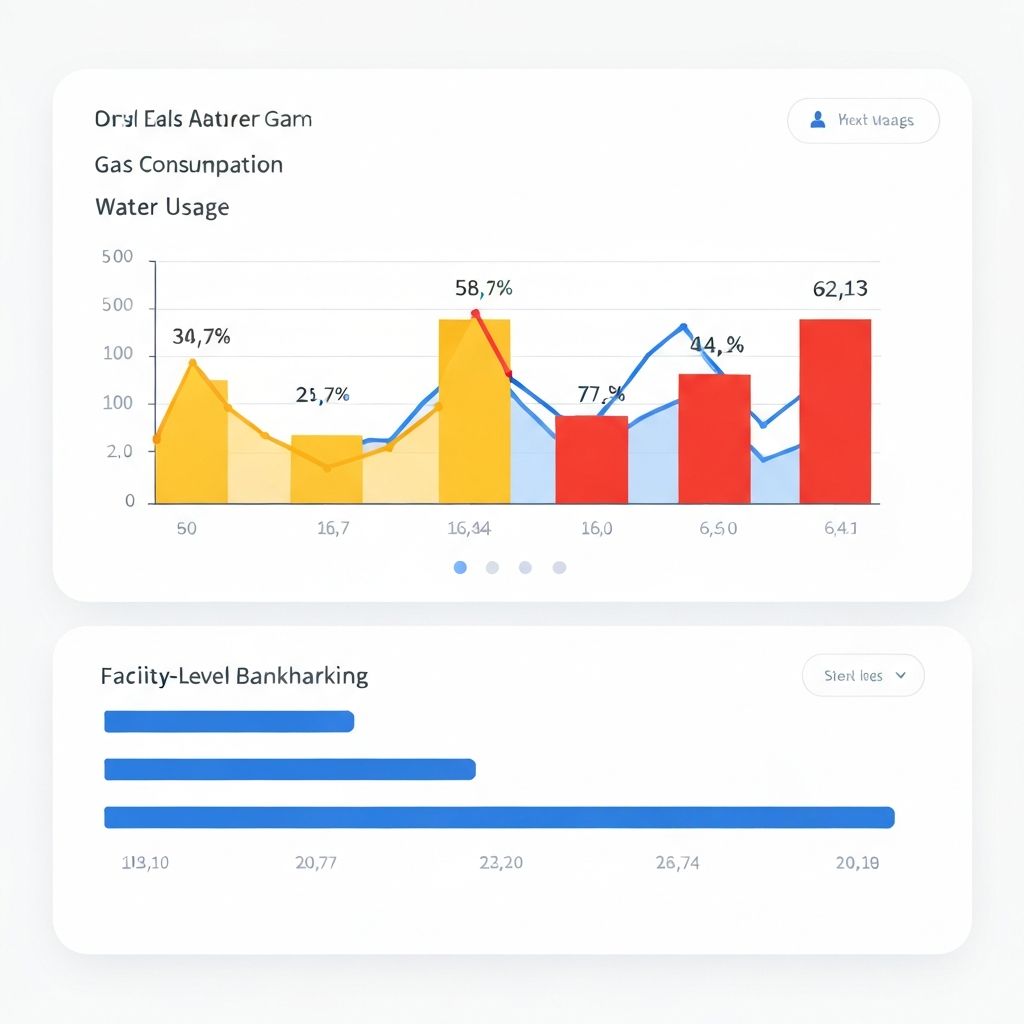
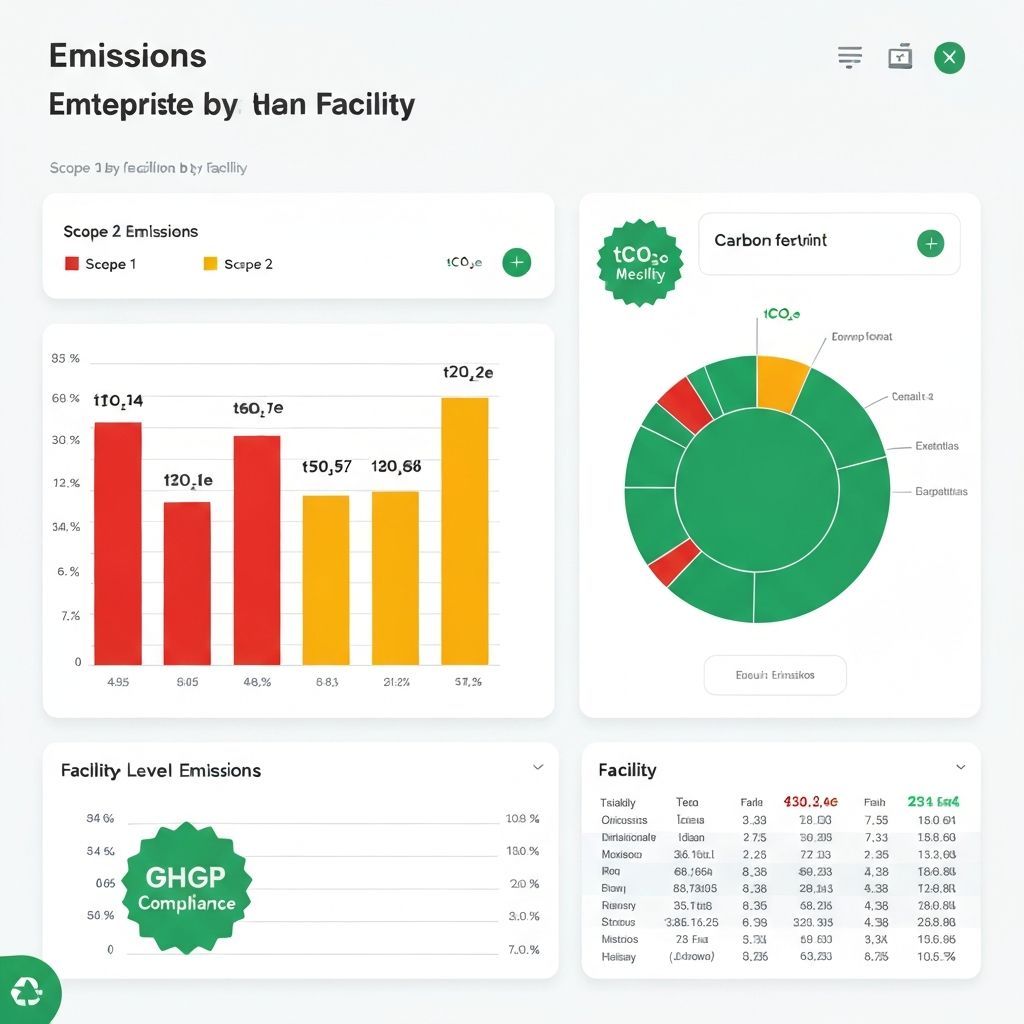
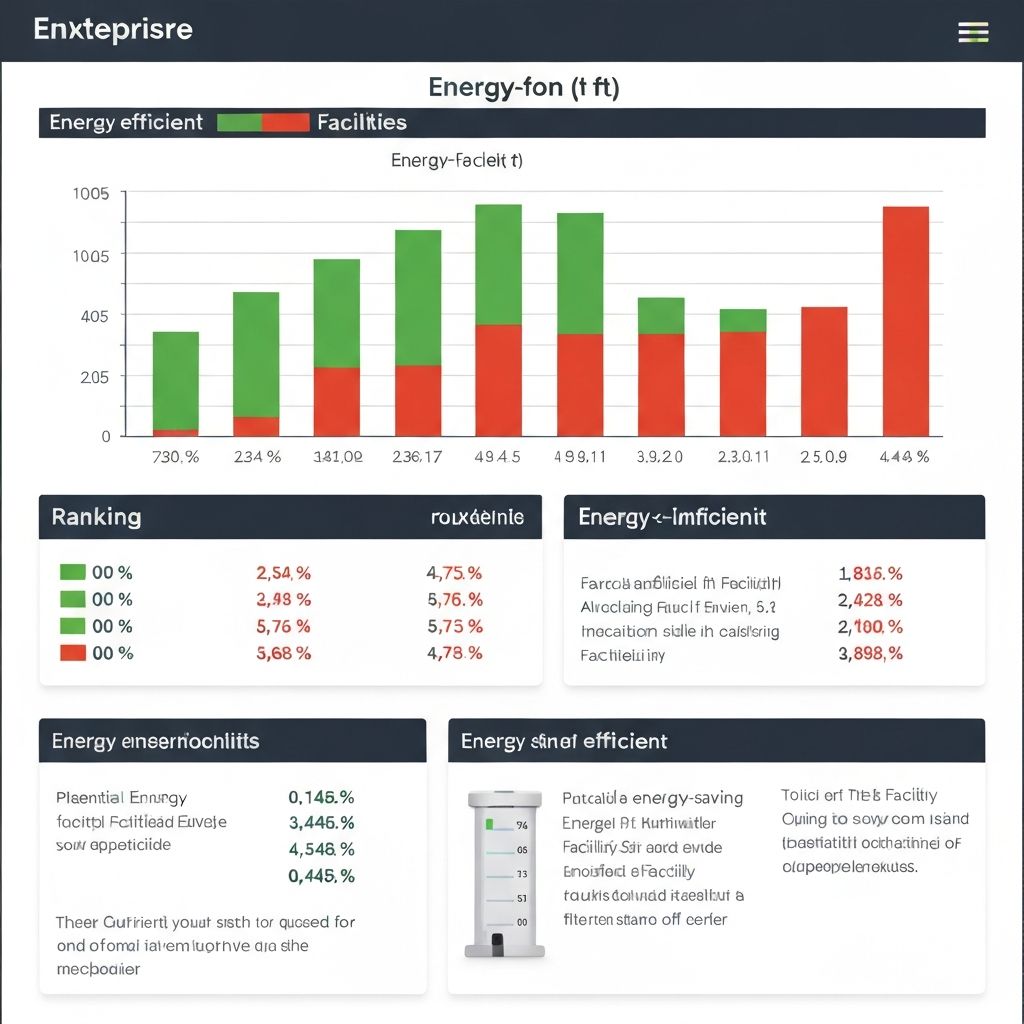
Turn parsed utility bill data into dashboards for usage, demand, cost, benchmarking, anomalies and GHG reporting.
Parsepoint adapts extraction, validation, and handoff steps to your document mix so teams can scale this workflow with less manual effort.